– by a New Deal Democrat
The majority wisdom is that the Fed will go ahead and raise interest rates again when it meets next week. I’ve been arguing for months that the data doesn’t support a rate hike. As of this morning, I am officially taking the position that, properly measured, inflation is under control and the US economy has indeed had *price declines* since last June.
The reason I’ve been mulling over this for over a year is that the shelter component of official inflation, which is 1/3 of the overall and 40% of the “core” measure, is lagging the real data by a lot – as in , by a year or more. So let’s start with an updated year-over-year chart of the official measure of inflation, owner-equivalent rent, which rose another 0.7% in February, with the FHFA home price index (/2 scale) declining from last June to the last reading for December:
As I have said many times, house prices lead OER by 12 or more months. I said over a year ago that OER would lead to higher core inflation even as real house prices peaked. And that’s exactly what happened, as OER is now up 8.0% year-over-year, an all-time high, while FHFA rose just 6.6% in December and is declining year-over-year at a rate of -1.6 %/month:
Note that the chart above also shows CPI less shelter, which is up 5.0% year over year. If we were to project the recent declines in the FHFA index forward to February, it would have risen just 3.4% year over year. Applying a 1/3 weight to shelter, the core CPI would rise by only 4.5% year-on-year if actual house prices were used in the calculation rather than the OER.
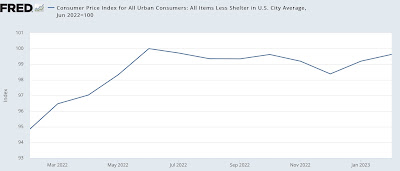
But this is by no means the most important point. As measured since last June, CPI less shelter is *down* -0.4%:
If we replace the FHFA home price index with the OER, the core CPI would have declined by -1.4% in December (since that’s when FHFA data ends):
If the FHFA price trend down since last June is projected forward into February, they would be down -1.3%. In other words, if the CPI used actual house prices and not the OER, since last June the core CPI would have been *down* -0.7%. UPDATE: Here’s what core inflation looks like on a year-over-year basis using the FHFA Home Price Index rather than the official measure of shelter through December:
As the rental CPI has accelerated since then, but house prices have likely continued to decline, there is every reason to believe that annualized core inflation using actual house prices is now below 3%.
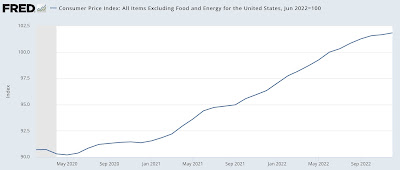
Indeed, with “core” inflation only 3.4% since last June:
If we were to substitute FHFA-measured home prices (down on forecast trend through February of -1.2% since then) for OER, then even core CPI would be down -0.3% since then.
To reiterate my main point: properly measured – certainly for purposes of Fed action – US consumer prices since last June have actually been in *deflation.* Moreover, there is every reason to believe that by the end of this spring even on an annualized basis, CPI, properly measured, will not be higher than 3.0% – within the Fed’s comfort zone.
Before I conclude, let me briefly highlight 3 more sectors.
First, now that oil and gas prices have stabilized, gas prices no longer have much of an impact one way or the other on the CPI. But as fuel oil fell a big 7.0% in February, the CPI for energy as a whole fell -0.6%. Energy prices are up 5.0% year-on-year, but have fallen -11.3% since peaking last June:
Another hot spot for inflation is food prices. This also slows down, if not completely. Food prices rose 0.4% in February, the smallest increase since April 2021:
Food prices on an annual basis remain with a growth of 9.5%:
Finally, new and used vehicle prices, another hot spot, are also generally moving in the right direction. The price of new vehicles increased by 0.3% in February, while used vehicles decreased by -2.8%. Thus, the prices of new vehicles on an annual basis have risen by 5.8%, while used cars are down by -13.6%:
To recap: outside of the official shelter measure, the only significant sector to show a price increase of more than 0.3% is food. Both headline and core inflation are rising just outside the Fed’s comfort zone because of the way housing prices are calculated.
But regardless of whether the OER “should” be used to calculate the CPI, it certainly *shouldn’t* be used by the Fed to set monetary policy. When properly measured, there has actually been *deflation* of both core and core measures since last June, and even on an annualized basis, inflation is very likely to be in the Fed’s comfort zone in a few months.


