– by a New Deal Democrat
“Analyzing April’s Personal Income and Spending Report: Insights on the Cyclical Peak”
As I’ve been saying for the past few months, the Personal Income and Expenditure report is currently tied with the Employment report as the most important monthly piece of information. And for the second month in a row, the results were very mixed. And also like yesterday, revisions played a big role, this time on the downside.
In nominal terms, personal incomes increased by 0.4%, and personal expenses – by 0.8%. As the applicable deflator rose 0.4%, real personal income was unchanged and real personal spending rounded up 0.5%. And real disposable personal income rose less than 0.1%, rounding up unchanged.
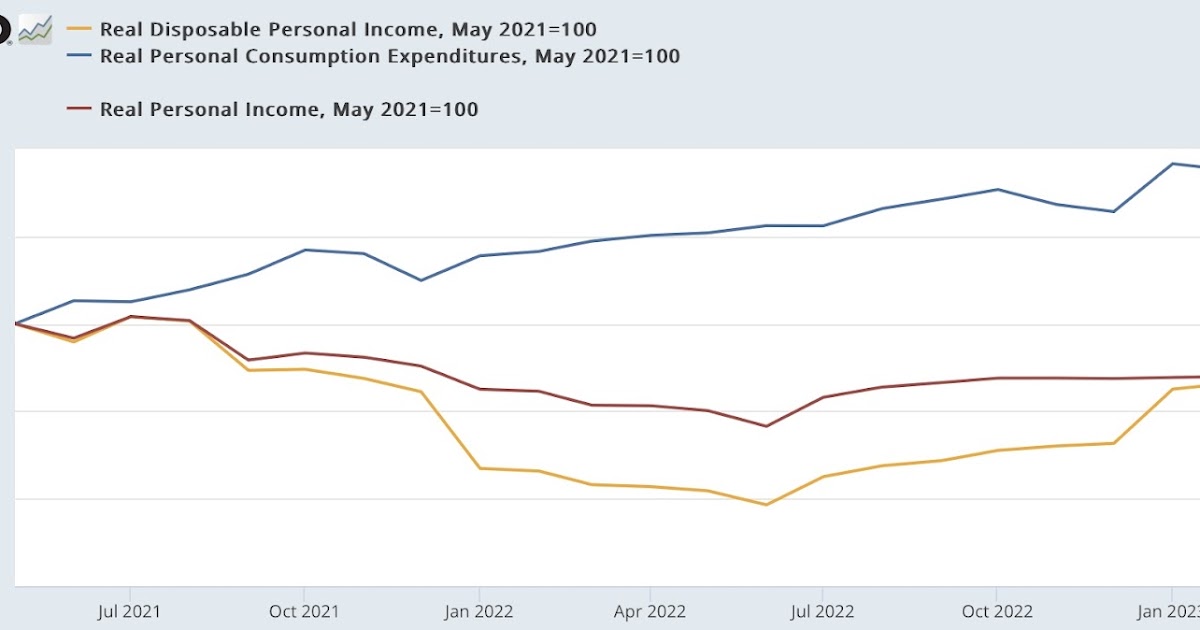
Since the start of the pandemic, real income has grown by 3.3% (versus a reported 4.0% in March) and real spending has increased by 8.2% (versus 7.6% in March). Since much of that was skewed by several rounds of stimulus, here’s the view normalized to 100 as of July 2021, including real disposable personal income (gold), which is much more affected by gas prices:
Note that net revisions added 0.1% to spending increases, but revisions subtracted a hefty -0.7% from revenue.
The revisions also affected the personal savings rate, which was also revised down by -0.6% for March from 5.1% to 4.5% and then fell by another -0.4% in April to 4. 1%. Due to the “paradox of saving”, while this decline is negative for individual households, it is good for the economy as a whole, as consumption makes up 70% of economic activity and consumption drives employment.
In the long run, however, this savings rate is very low, exceeded only by the downward trend in the pre-pandemic 50 years between November 2004 and September 2008:
Finally, let’s turn to the indicators the NBER uses to determine the beginning and end of a recession, two of which were updated this morning.
The good news is that real personal income minus government transfers (blue in the chart below) rose 0.2% in April to a new high. The bad news is that this is against some very large downward revisions over the past 6 months, meaning that April’s “record high” is actually -0.6% below where we thought we were in March, and more just over 0.1% above its current previous high from last September:
The other big matching indicator used by the NBER updated today, real manufacturing and trade sales for March, was down another -0.6% from its most recent peak in January:
Here’s what all the “big 4” matched indicators look like, including industrial production and nonfarm payrolls, each normalized to 100 at their respective peaks:
Two of the four – industrial production and real manufacturing and trade sales – are down from their peaks. The third, real personal income minus transfer receipts, has remained essentially unchanged since last September. Only jobs continue to increase significantly.
Also, on an annual basis, real personal income less government transfers rose 1.2%, industrial production rose 0.2%, and real manufacturing and trade sales rose 0.7%. The historical record of more than half a century shows that when all three of these matching indicators were at their current year-over-year levels, they are now, with *no* exceptions, the recession was already underway:
In summary, while there was good news on real personal spending and on real personal income net of government transfers; there were many negative revenue revisions. Although it remains unlikely, along with yesterday’s report of negative Q1 gross domestic income, including the average GDP and GDI; this report increases the chances that the NBER will ultimately reject continued nonfarm payroll growth and declare that there was a cyclical peak in January.


