
– by a New Deal Democrat
Since there is no big economic news again today, let me write a little more detail about the January house prices reported yesterday, relative to the CPI for shelter.
Here’s the monthly % change over the last 18 months for the owner-equivalent rent in the CPI (blue), relative to the Case Shiller National Index (gold) and the FHFA Purchase Only Index (red) (note: both home price indices /2 .5 for scale):

Month-over-month, the Case Shiller index was down -0.2% on a seasonally adjusted basis, while, as I noted yesterday, the FHFA index was up 0.2%.
But the most important detail is the comparison of the changes since the beginning of 2022 with the last 6 months. Owner-equivalent rent has increased between 0.6% and 0.8% per month since last May. In contrast, both house price indices began to decline sharply on a monthly basis at the beginning of last June. In other words, there are two more months (March and April) when owner-equivalent rent will compare below 0.5% in the same months of 2022, meaning that year-on-year OER is likely to continue to rise. increases at least slightly for a few more months.
Meanwhile, as the year-over-year chart, including the Case Shiller and FHFA indices, shows, year-over-year price increases continue to slow sharply, to +3.8% and +5.3% respectively as of January:

which (after /2.5 for scale) suggests that the OER will be well contained until next winter.
As I wrote a few weeks ago, the CPI excluding shelters was up just +0.7% in the 8 months since last June, ie. with only 1.0% per annum:
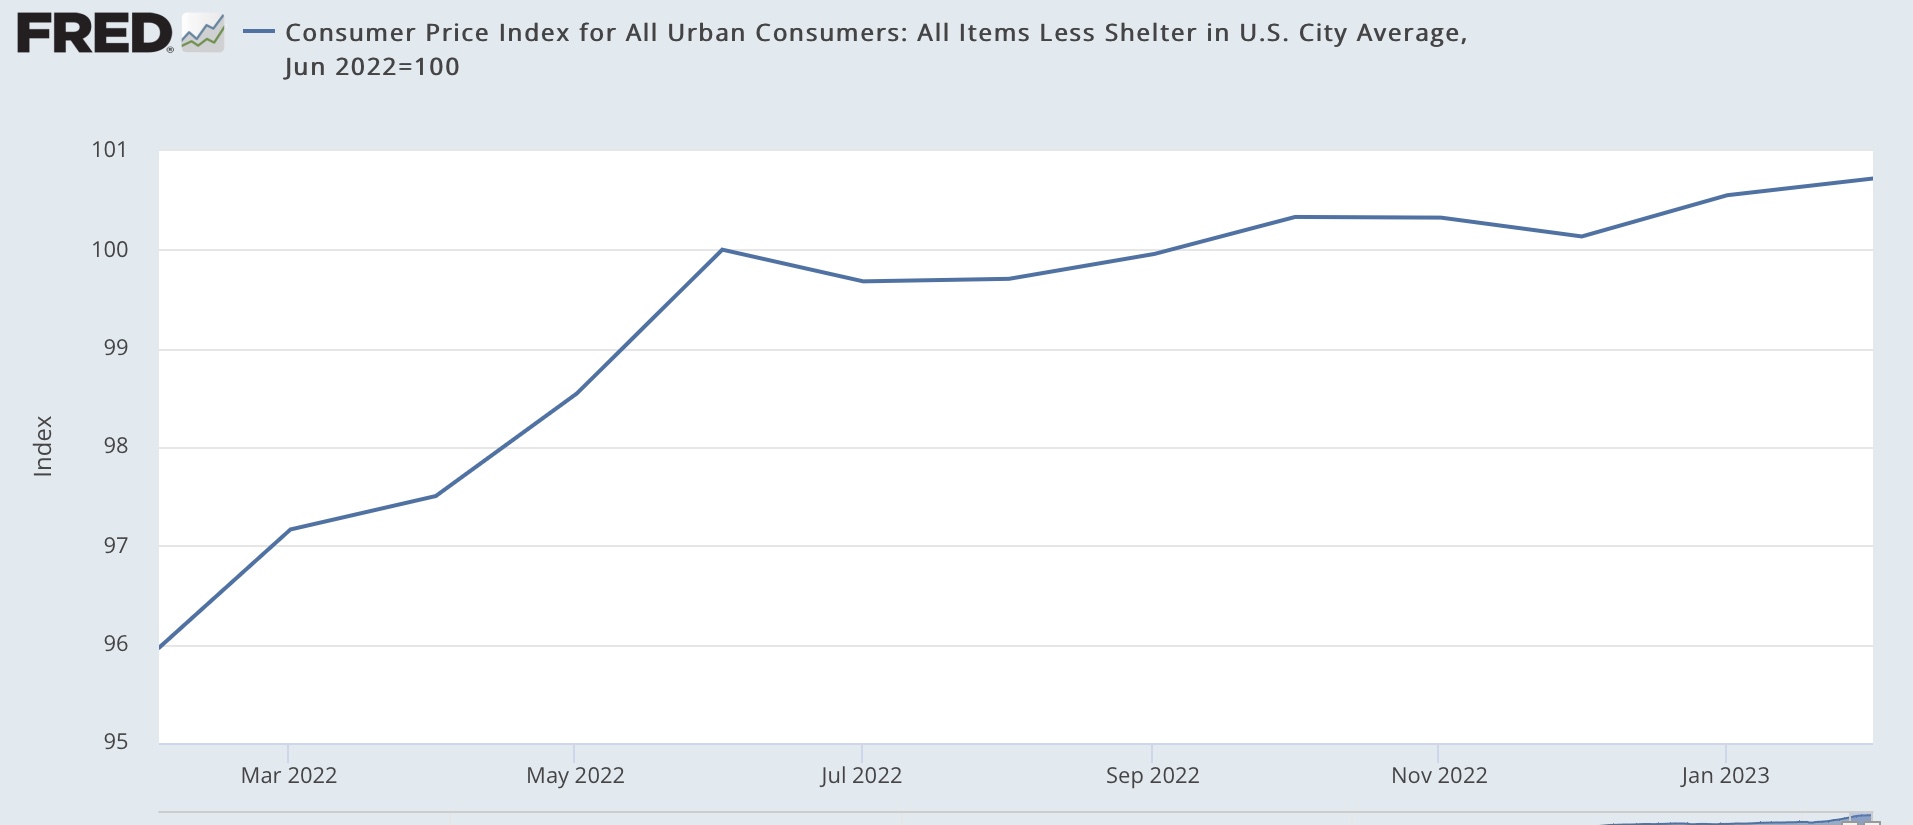
In making its case for continuing to raise interest rates, the Federal Reserve ignored this and hung its hat on service inflation more broadly. personal consumer spending to be released on Friday.