(*hyperbole)
– by a New Deal Democrat
No major new economic data until Thursday this week. In the meantime, there was a lot to digest about the hit Friday jobs report I already did, so I’ll spend a few (maybe 3!) days diving into the details. Today, I’ll address how seasonality and a very tight labor market were decisive in Friday’s report. Tomorrow (and maybe Wednesday, depending on the length of what I have to say) I’ll be dealing with revisions to both the business and household data for 2022.
Let me start with this thought from you: Do you really think that bars and restaurants hired almost 100,000 more people in January as shown in the jobs report?
Yeah, me neither. And the truth is, they didn’t! In fact, they cut a total of 183,000 jobs. Here are the seasonally adjusted (blue) versus seasonally non-seasonally adjusted (red) numbers from July 2021:
Here’s the longer-term outlook since the streak began in 1991:
In a normal year, bars and restaurants typically lay off 200,000 or more employees in January. Only once (in 2006) were they cut less than last month.
Seasonal adjustment (and it’s totally valid, I’m not saying it’s inappropriate in any way) turns this relative lack of layoffs in January into stellar job gains.
Similar patterns, though less drastic, are emerging across the spectrum of jobs. Let me give another example.
Virtually every indicator over the past few months has shown that the manufacturing sector has entered a downturn. The ISM manufacturing new orders index is at a level that has almost always signaled a recession in the past. Industrial production has seen a slight decline over the past few months. The average manufacturing workweek has also declined sharply enough from its peak to match a recession. And in November and December, even after revisions, manufacturing added just 13,000 workers per month. So it was reasonable to expect manufacturing employment to decline in January. Instead, 19,000 jobs were added on a seasonally adjusted basis.
So here are manufacturing jobs seasonally adjusted (blue) and not (red) as of July 2021, showing that there were actually 91,000 layoffs, or 0.7% of the workforce in December:
Here’s the longer-term view of the monthly % change in non-seasonally adjusted manufacturing jobs from the start of the modern era in 1983 to the pandemic, adding 0.7% so that the 2023 % shows as 0:
There were fewer layoffs this January than in most years over this entire 35+ year period. Seasonally adjusted, this means a strong increase (again, a perfectly valid adjustment).
In fact, for private payrolls, January’s monthly cuts of 1.632% of the labor force in December were the smallest in the entire 80+ year history of the data (shown as 0 in the graph below):
Government employment also jumped by 74,000 in January. This was also heavily influenced by seasonal factors, but also by the return to work of 48,000 University of California workers who were on strike in November. The resulting non-seasonally adjusted decline for January of -1.5% was the smallest since the end of the Great Recession (note that July, not January, was the month of the NSA’s biggest declines in government jobs):
Let me emphasize again that there is nothing wrong with making this seasonal adjustment.
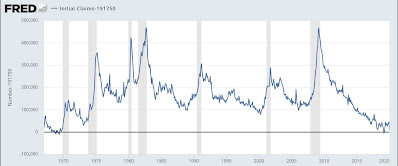
But let’s digress slightly and look at the entire historical record for the 4-week average of initial claims before the pandemic:
In January, an average of just 191,750 people filed initial claims. With the exception of the 1960s (when the US population was only half of what it is now), March and April of 2019 and last year are the lowest monthly averages on record. Here’s a close-up of seasonally adjusted and non-seasonally adjusted initial claims over the past 18 months, showing that the typical early January spike in claims just hasn’t materialized this year:
Basically no one* gets laid off. There was a seasonal increase in hiring for the holiday season, but overall, businesses decided not to lay off some of these people, but to keep them on the payroll. That, plus the resolution of the California strike, is why wages jumped so much in January. (*hyperbole)
Which begs the question, what will happen in February? As shown in the chart below of seasonally adjusted employment during the last expansion, February is generally positive, leading to the peak months of March through June:
Now let’s take a look at the revisions just made for 2022:
January 2022 was revised down from 504,000 to 364,000, while February was revised up from 704,000 to 904,000. These were the two largest revisions of the entire year, suggesting that seasonality played a role in these two months.
In conclusion, here’s what we have: In a very tight labor market, employers were generally reluctant to lay off seasonal workers in January, choosing to keep them on the payroll. This resulted in large profits from working on a seasonal basis. But we’ll have to wait for the February report to see if this is a sign of renewed strength in the labor market or if employers have less need to hire new workers as a result. In other words, will the force continue from January into a month where actual hiring is expected, not layoffs.
Tomorrow: the story behind the revisions


